Dashboards & reporting
From Spreadsheets to Dashboards: When Is It Time to Upgrade Your Reporting?
Recognize when reporting has outgrown a workbook, and plan a dashboard around decisions rather than more charts.
A spreadsheet can be an excellent reporting tool. It is flexible, familiar and well suited to exploring a question that is still taking shape. A dashboard becomes useful when the recurring work around the spreadsheet starts to obscure the decisions the report is supposed to support.
The choice is not simply about how many rows a workbook contains or whether the charts look polished. It is about repeatability, shared definitions, access and the effort required to produce a trustworthy answer.
Look for problems in the reporting process
Consider a hypothetical operations team that prepares a weekly delivery review. One person exports open work, another updates expected completion dates, and a manager combines the files. The report may be accurate, but its preparation depends on several undocumented steps.
Watch for recurring signals:
- The same data is exported, cleaned and copied for each reporting cycle.
- Different teams use different definitions for the same measure.
- People distribute copies because they cannot safely share the working file.
- The report’s owner is the only person who understands its formulas.
- A late input means nobody knows whether the final figures are complete.
- Managers repeatedly ask the same follow-up questions that the report cannot answer.
None of these automatically requires a dashboard. Some can be addressed with a better input template, protected calculation areas or clearer ownership. The important question is whether improvements to the workbook still solve the underlying problem.
Separate a data problem from a presentation problem
A dashboard cannot repair inconsistent source records merely by displaying them attractively. If different teams classify “completed” differently, a shared chart can spread that disagreement faster.
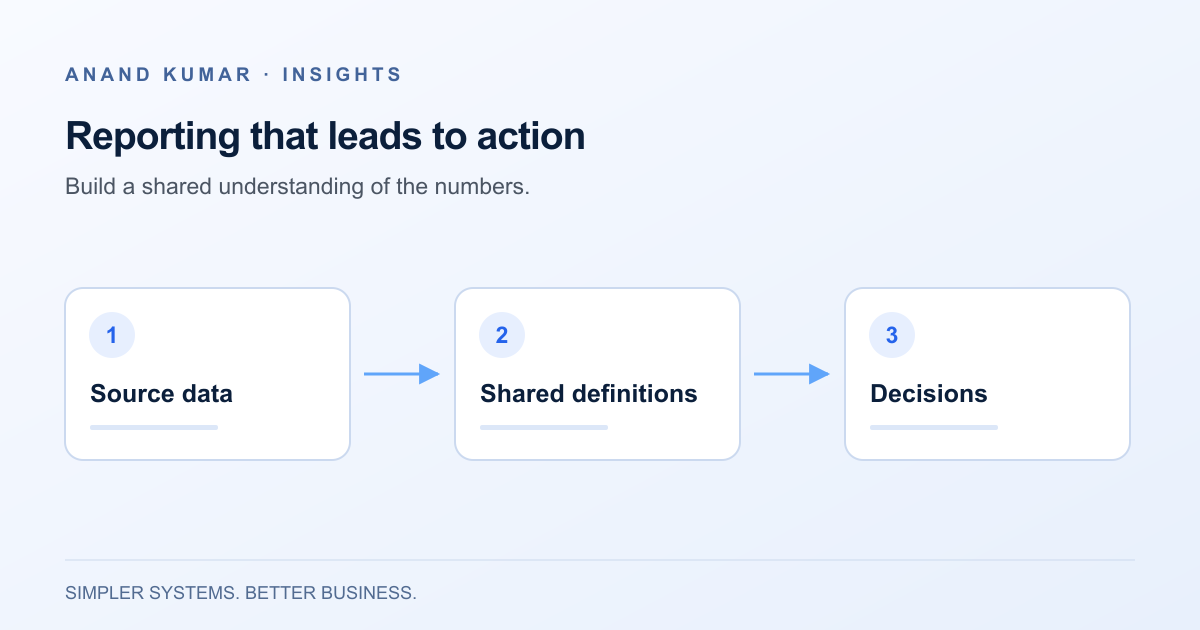
Before choosing a tool, define each important measure in plain language. For a delivery report, specify which records are included, what completion means, which date determines the reporting period and how cancelled work is treated. Assign someone to approve changes to that definition.
Check the source data against those rules. Missing dates, duplicate identifiers and inconsistent categories may need correction upstream. Keep a visible record of exclusions rather than silently discarding awkward records. A smaller, well-understood dataset is more useful than a comprehensive-looking report with unclear assumptions.
A dashboard earns its place by supporting decisions
Start with the meeting or action the report needs to support. An operations manager may need to identify work at risk and assign follow-up, rather than browse a wall of charts.
For each proposed view, ask:
- Who uses it?
- What decision should it help them make?
- What detail do they need to investigate an exception?
- How current must the information be?
- What should happen when the data is incomplete?
These questions shape the design. A summary may need a drill-down to the underlying records. A filter may need a clear default. A refresh timestamp should tell readers when the data was last successfully updated, not merely when they opened the page.
Avoid adding a metric solely because it is available. If nobody can explain what action a change in that metric would prompt, it may not belong in the first version.
Know when a spreadsheet is still the better fit
Keep a workbook when the task is exploratory, the audience is small and the people using it need to change assumptions frequently. A well-maintained spreadsheet can also remain appropriate for a modest recurring report with stable inputs and a clear owner.
A dashboard is less helpful if the main requirement is extensive data entry, approvals or updating operational records. Those needs may point to a workflow tool or application, with reporting as one part of it. The distinction is explored in choosing between spreadsheets, no-code tools and custom applications.
Do not remove the ability to inspect or export relevant records simply to make the interface cleaner. A trustworthy summary should have a practical route back to its supporting detail, subject to appropriate access controls.
Migrate one reporting question at a time
Choose a narrow report with an engaged owner. Preserve the current workbook as a reference while building a parallel version from the same agreed dataset.
Compare record counts and representative totals, then investigate differences. Pay particular attention to date boundaries, exclusions, duplicate records and records that change after the reporting period ends. Reconciliation is a chance to uncover assumptions in both versions, not a requirement to reproduce an existing spreadsheet error.
Agree on acceptance criteria before retiring the manual process. These might include matching the approved calculation rules, showing data freshness, providing the necessary detail and completing an agreed recovery procedure when an input fails. Use criteria relevant to the business rather than an arbitrary performance promise.
Introduce the dashboard to the people who will actually use it. Observe whether they can answer the intended question and explain what the figures mean. A short explanation next to a measure can be more valuable than another visualization.
Budget for the work after launch
Someone must own the data connections, metric definitions and access permissions. A new category in the source system can affect a chart just as much as a broken connection. Decide who reviews such changes and how users report discrepancies.
Plan for stale data. If a refresh fails, show the last successful update and make the failure visible to the owner. Decide whether the dashboard should continue displaying older data with a warning or withhold a view that would be misleading.
The takeaway: upgrade when recurring reporting needs shared, repeatable answers that a workbook is becoming difficult to maintain. Keep the spreadsheet where it remains useful, and build the dashboard around one decision at a time. Dashboard and reporting support can help turn that first reporting question into a manageable scope.